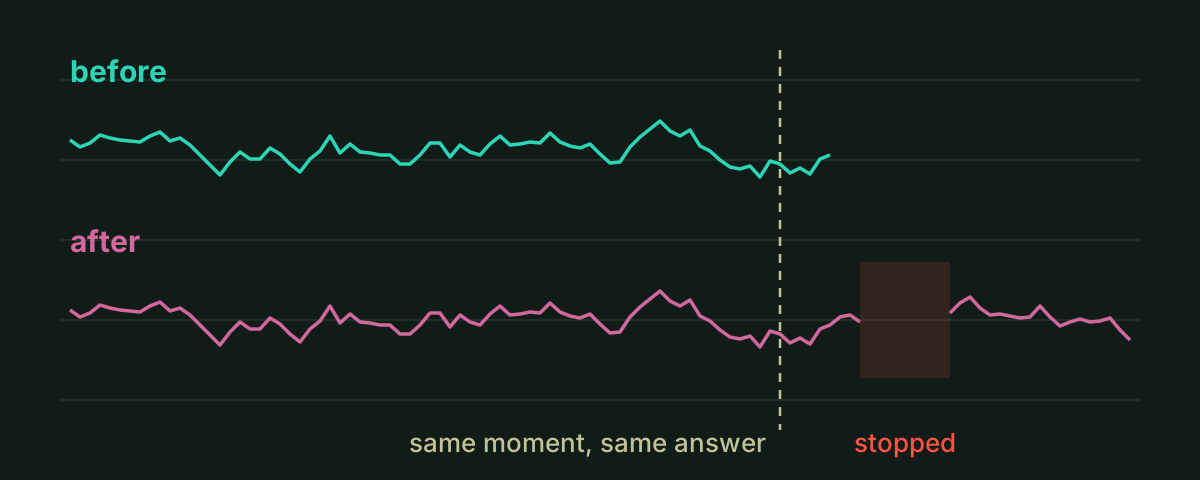
The graphs came back, and that proved nothing
on this page
On 18 October I moved Grafana and Prometheus off my ZimaBoard and onto a new VM. When it came back up, the System row drew every panel, with no “No data” anywhere. That looks like success. It’s also what you’d see if most of the history had gone missing on the way, because a graph draws what’s there and has no idea what isn’t.
It wasn’t much data. One tarball, 483,112,960 bytes, 78 files, about a month of metrics from a homelab. tar and scp would’ve moved it. Moving it was never going to be the hard part. The hard part was being able to say afterwards that what came out was what went in, and having a way back if it wasn’t.
The repo for this is private because it carries other things I can’t publish, so the excerpts below are the parts that matter and the diagram is drawn for this post.
My ZimaBoard started as a NAS and ended up running far too much, so a small server went in beside it, with a VM called Coastguard to take the services. Grafana and Prometheus went first.
The easy option was to start again. The dashboards are generated from code and live in git, so a fresh Grafana would’ve had all of them straight away. What it wouldn’t have had was the history, back to 19 September, the night the stack first ran. So this was a move and not a rebuild.
Five things:
- Keep the data. Grafana’s database and Prometheus’s whole store, every job, back to the oldest sample.
- Stop as little as possible. Only the two containers that were actually moving.
- Only read the old data. If the new copy turned out bad, the old one had to still be good.
- Have a way back. At every step, not just at the end.
- Only say “same” with evidence. Anything missing counts as a failure, not a pass.
node-exporter looks like part of the stack, and it sits in the same compose file, but it reports on the machine it runs on. Move it to the VM and it would happily start reporting on the VM. So it stayed on the board, and Coastguard’s Prometheus scrapes it across the LAN. That’s also why I stopped two containers by name instead of stopping the app, which would’ve taken node-exporter down with them.
That set a small trap. On the board, Prometheus reached node-exporter by its service name, so every sample stored so far carried instance="node-exporter:9100". Scrape it by LAN address instead and the label changes, and the history and the new samples turn into two series that meet at the cutover. So the new config puts the old name back:
relabel_configs:
  - target_label: instance
    replacement: node-exporter:9100
The job names stayed the same too, so every job="..." selector on every dashboard carried on working.
That doesn’t mean you always keep the label. Another exporter moved two days later and I deliberately let its instance change, because its counter starts again with the process. As a new series, increase() just sees a new line. Joined to the old one, it would see a reset that never happened.
The cost of all this is that node-exporter now listens on the board’s LAN address with no authentication. It isn’t on every interface, but anything allowed on that LAN can read it, and compose can’t limit it to one client. That would take a firewall rule. I’ve left it and written it down.
Before anything stopped, a script asked the running service a set of questions and saved the answers to a private file. Afterwards it asked Coastguard the same questions and compared:
- Grafana’s version and database health
- the identity of every dashboard
- samples per job in the day before a fixed reference time
- samples per job in one hour, a week before it
- the board’s 15-minute load at the reference time
- the oldest sample Prometheus holds
The history questions look like this:
def history(grafana: Grafana, at: float) -> dict:
    return {
        DAY_SAMPLES: grafana.promql("sum by (job) (count_over_time(up[1d]))", at),
        WEEK_SAMPLES: grafana.promql("sum by (job) (count_over_time(up[1h]))", at - WEEK),
        BOARD_LOAD: grafana.promql('node_load15{job="node"}', at),
    }
The at is what makes it work. Ask “how many samples in the last day?” twice and you’ll get two different answers, just because time passed and the outage is in one of them. So the reference is fixed, an hour before the first capture, and both sides get asked about that exact moment. Every sample those queries count had already been written before anything stopped.
The part I care about most is what happens when a question has no answer. A comparison that only checks equality has a nasty failure. If a query quietly returned nothing on both sides, nothing equals nothing and the line reads as a pass. So the check is this:
same = bool(value) and value == other
Two empty answers are equal, so “same” has to fail when the evidence is missing.
The before capture won’t save at all if it’s missing a dashboard from the repo, samples for any job, the board’s load or the oldest sample, and the after step holds both files to the same rule. I ran it on two empty fingerprints while writing this. {} == {} is True in Python. The comparison reports seven differences.
The oldest sample gets one exception. It’s allowed to get later, because retention might have trimmed a block since. It’s not allowed to get earlier, because that would be data that was never in the original. As it turned out it didn’t move at all: Sat Sep 19 21:59:51 2026 on both sides.
This doesn’t prove every sample survived. It’s a spot check: two windows, one load reading, one timestamp. A damaged block from early October would pass it. The SHA-256 comes at it from the other direction. The archive’s checksum matched on both machines, so the bytes arrived. The fingerprint says Prometheus and Grafana read those bytes back and gave the same answers as before. Neither covers it alone, and both together still don’t say every block is readable.
There are 50 unit tests around this tooling, and they all passed when I reran them for this post. They’re local fixtures and none of them touches a machine. The export’s success path needs real root-owned directories, so they don’t cover that. Doing it for real was the test of that part.
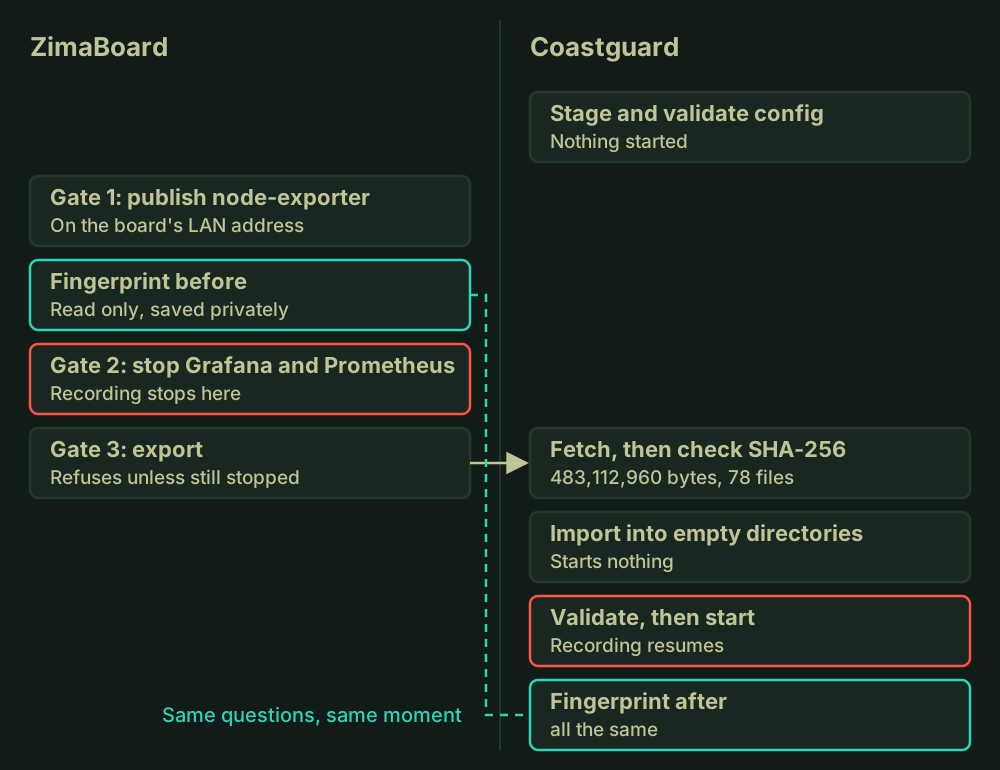
I approved and ran each step that changed the board myself. In order:
- Stage. Config and pinned images went onto Coastguard and got validated before anything started there.
- Gate 1, publish node-exporter. Then check Coastguard could reach it and nothing else had moved. All 22 of Uptime Kuma’s latest beats stayed up.
- Fingerprint before. Read only.
- Gate 2, stop Grafana and Prometheus. Kuma’s Grafana monitor got paused first. From here, nothing’s being recorded.
- Gate 3, export. It refuses unless both containers are stopped, notes their status and their start and finish times, writes the tarball and checks those again. If anything changed, nothing gets published.
- Fetch.
sha256sum -chas to pass on arrival. - Import. It works from a private snapshot of the archive, checks the checksum, the file count, the free space and Grafana’s SQLite integrity, and only replaces directories it has verified are empty. It never starts a container.
- Start.
deploy.sh --startrefuses without a completed import, and validates the dashboards, compose files, Prometheus config and provisioning first. - Fingerprint after. The result was
all the same, with five targets up.
The hole in the graphs is the price of stop-and-copy. Prometheus records nothing between the stop and the start. What you get for it is files that can’t change while they’re being read, which is what the export’s before and after check on the containers is there to confirm. I didn’t write down how long the gap was, which is a bit rich in a post about measuring things.
The old copy was stopped, not deleted. That left three layers: the stopped containers with their original data on the board, the verified archive beside them, and the fetched copy on Coastguard. Going back is two commands, one to stop Coastguard’s stack and one to start the board’s containers. Whatever Coastguard had recorded by then stays on Coastguard.
I’ve got no record of ever running it, so that’s a plan and not a proven procedure. I also couldn’t prove whether ZimaOS would start those stopped containers again if the board rebooted, so the notes say to check after any reboot.
The move itself went fine. The two problems came afterwards:
- The restore drill. The next night’s backup of the VM, 5.47 GB, went onto a temporary VM with its network link down. SQLite’s integrity check came back
ok, six config hashes matched the live ones and the oldest sample matched too. Prometheus didn’t start, though. It sat at exit status 255 until it was started by hand, and my notes don’t say why. The recovery steps now say to check every expected container and not to trust the restart policy. - The reboot. Two days after the move I rebooted Coastguard, and Prometheus stayed down while everything else came back. A deploy had reloaded its config with
docker kill, and Docker records anydocker kill, whatever the signal, as a manual stop.restart: unless-stoppedthen did exactly what it says. About two and a half minutes of samples are gone.
docker kill -s HUP prometheus >/dev/null   # wrong: recorded as a manual stop
docker exec prometheus kill -HUP 1         # sent from inside, nothing recorded
I tried the second line on Coastguard: the config reloaded and HasBeenManuallyStopped stayed false. A test now forbids docker kill, stop and restart in the installer. The reboot that would prove it is still an open box in my notes.
Two things, and the second matters more.
“It moved” and “it’s the same” are different claims and they need different evidence. A checksum answers the first one. It can’t tell you whether the service on the other end reads the data the way the old one did.
And the only cheap moment to collect the evidence is before you touch anything. Once the old service is down, asking it means starting it again. Every comparison in this move leaned on one file saved before gate 2.
So before you move anything with history in it, write the questions down first and make “I don’t know” count as a fail. If last month were gone from your system today, what would you ask it that would notice?